Overview
View the full project report here
The US Census Bureau has categorized the 50 states and District of Columbia into 4 distinct regions. Those regions are further divided into 9 districts. For the purposes of this report, my team and I are focusing on the following districts:
- Mountain Division
- Pacific Division
- South Atlantic Division
I examined the impact of two federally funded tax programs, the New Markets Tax Program and the Low Income Housing Tax Credit program on qualifying neighborhoods. In order to evaluate the change in neighborhoods, we will be looking at Social Variability Index (SVI) Census variables which are defined by U.S. Centers for Disease Control and Prevention (CDC)’s to measure neighborhood vulnerability. In addition, we will also be looking at economic outcomes variables to include: median home values and median income from Census data, and the Federal Housing Finance Agency’s house price index.
Data
Data for this project was sourced from the U.S. Census Bureau (2010 and 2020) and the Federal Housing Finance Agency, with all 2020 data normalized to 2010 census tract boundaries using NHGIS crosswalks.
Social Vulnerability Index data was based on CDC-defined categories:
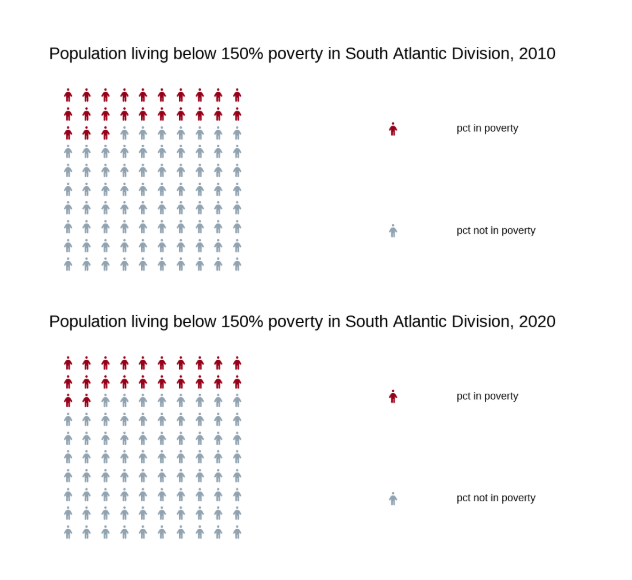
- Socioeconomic Status (SES): percent living below 150% poverty, percent unemployed, population housing cost-burned, percent adults without high school diploma, percent without health insurance.
- Household Characteristics: percent age 17 and under, percent age 65 and over, percent disabled civilians, percent single parent families, percent limited English speakers.
- Racial/Ethnic Minority Status: percent minority race/ethnicity.
- Housing Type/Transportation: percent in multi-unit housing, percent in mobile housing, percent in crowded living spaces, percent with no vehicle access, percent living in group quarters.
The US Census Bureau has categorized the 50 states and District of Columbia into 4 distinct regions. Those regions are further divided into 9 districts. For the purposes of this report, we are focusing on the following districts:
Mountain Division Pacific Division South Atlantic Division We examined the impact of two federally funded tax programs, the New Markets Tax Program and the Low Income Housing Tax Credit program on qualifying neighborhoods. In order to evaluate the change in neighborhoods,we will be looking at Social Variability Index (SVI) Census variables which are defined by U.S. Centers for Disease Control and Prevention (CDC)’s to measure neighborhood vulnerability. In addition, we will also be looking at economic outcomes variables to include: median home values and median income from Census data, and the Federal Housing Finance Agency’s house price index.
The purpose of the federally funded New Markets Tax Credits and Low Income Housing Tax credits is to provide low-income neighborhoods investment funding to improve vulnerable neighborhoods.
The CDC’s SVI looks at 4 categories of vulnerability. All variables within these categories can be pulled from Census Data API.
We will also be including the following economic variables in our analysis: Median Home Values, Median Incomes, and House Price Index.
We will look at these variables in vulnerable neighborhoods who received investment from the NMTC and LIHTC programs and compare them with neighborhoods who did not receive funding from these programs. Specifically we will be looking at 2010 and 2020 Census data for these neighborhoods. It is our hypothesis that those neighborhoods who received NMTC and LIHTC funding will have decreased SVI vulnerability flags and improved economic outcomes.
DataPermalink Data for this project was sourced from the U.S. Census Bureau (2010 and 2020) and the Federal Housing Finance Agency, with all 2020 data normalized to 2010 census tract boundaries using NHGIS crosswalks.
Social Vulnerability Index data was based on CDC-defined categories:
Socioeconomic Status (SES): percent living below 150% poverty, percent unemployed, population housing cost-burned, percent adults without high school diploma, percent without health insurance. Household Characteristics: percent age 17 and under, percent age 65 and over, percent disabled civilians, percent single parent families, percent limited English speakers. Racial/Ethnic Minority Status: percent minority race/ethnicity. Housing Type/Transportation: percent in multi-unit housing, percent in mobile housing, percent in crowded living spaces, percent with no vehicle access, percent living in group quarters. Additional variables included median income, median home values, and the House Price Index. Median income and median home values were pulled from the census API. The house price index was pulled from the Federal Housing Finance Agency API.
We identified tracts that were eligible for our two tax programs; the New Markets Tax Credit (NMTC), and the Low Income Housing Tax Credit (LIHTC). We wrangled our data to determine tracts that were deemed eligible for these tax credits, but excluded tracts that received funding prior to 2010, to insure that we are measuring the impact of the programs.
The analysis covered 73,057 tracts nationally, with 5,250 in the Mountain Division, 13,706 in the South Atlantic Division, and 10,867 in the Pacific Division. Eligibility and funding data for NMTC and LIHTC were integrated to isolate program impacts post-2010, focusing on new interventions and avoiding pre-existing funded tracts.
Methods
A variety of spatial and statistical techniques were used to analyze the impact of tax credit investments. This included:
- Waffle Charts
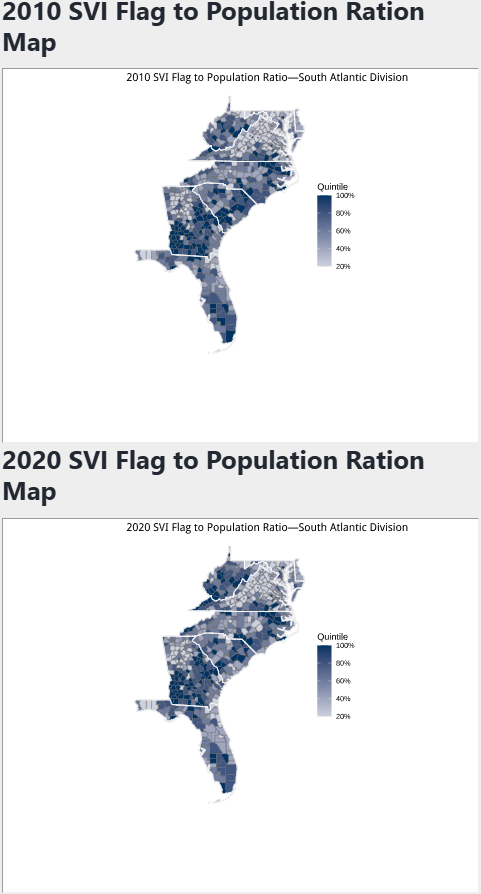
- Choropleth and Bivariate Mapping
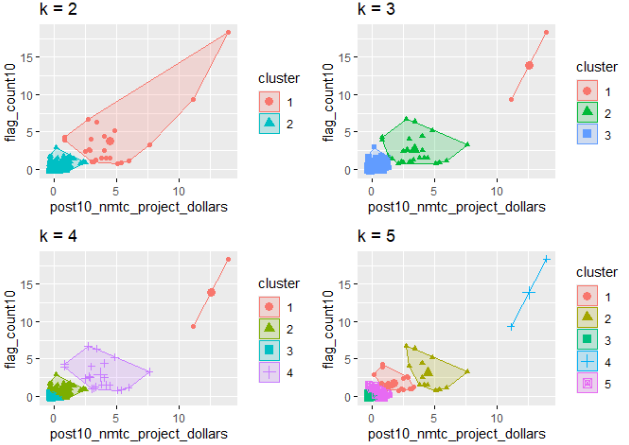
- K-Means Clustering
- Correlation Analyses (Pearson’s R)
To estimate causal impacts, difference-in-differences (diff-in-diff) regression models were used, controlling for metro-level effects via CBSA fixed effects. This approach allowed for comparisons of change over time between treated (funded) and untreated tracts in both divisions, across multiple outcome variables.
Results and Conclusion
In the Mountain, Pacific, and South Atlantic Divisions, the NMTC and LIHTC programs did not produce statistically significant improvements in any of the four social vulnerability categories or most economic indicators.
A moderate to strong correlation was observed between funding and vulnerability in the Mountain Division, suggesting relatively effective targeting; however, actual program impacts were negligible.
Overall, neither program demonstrated clear effectiveness in reducing social vulnerability or driving economic improvements over the decade studied.